
The numbers for the month, with names attached.
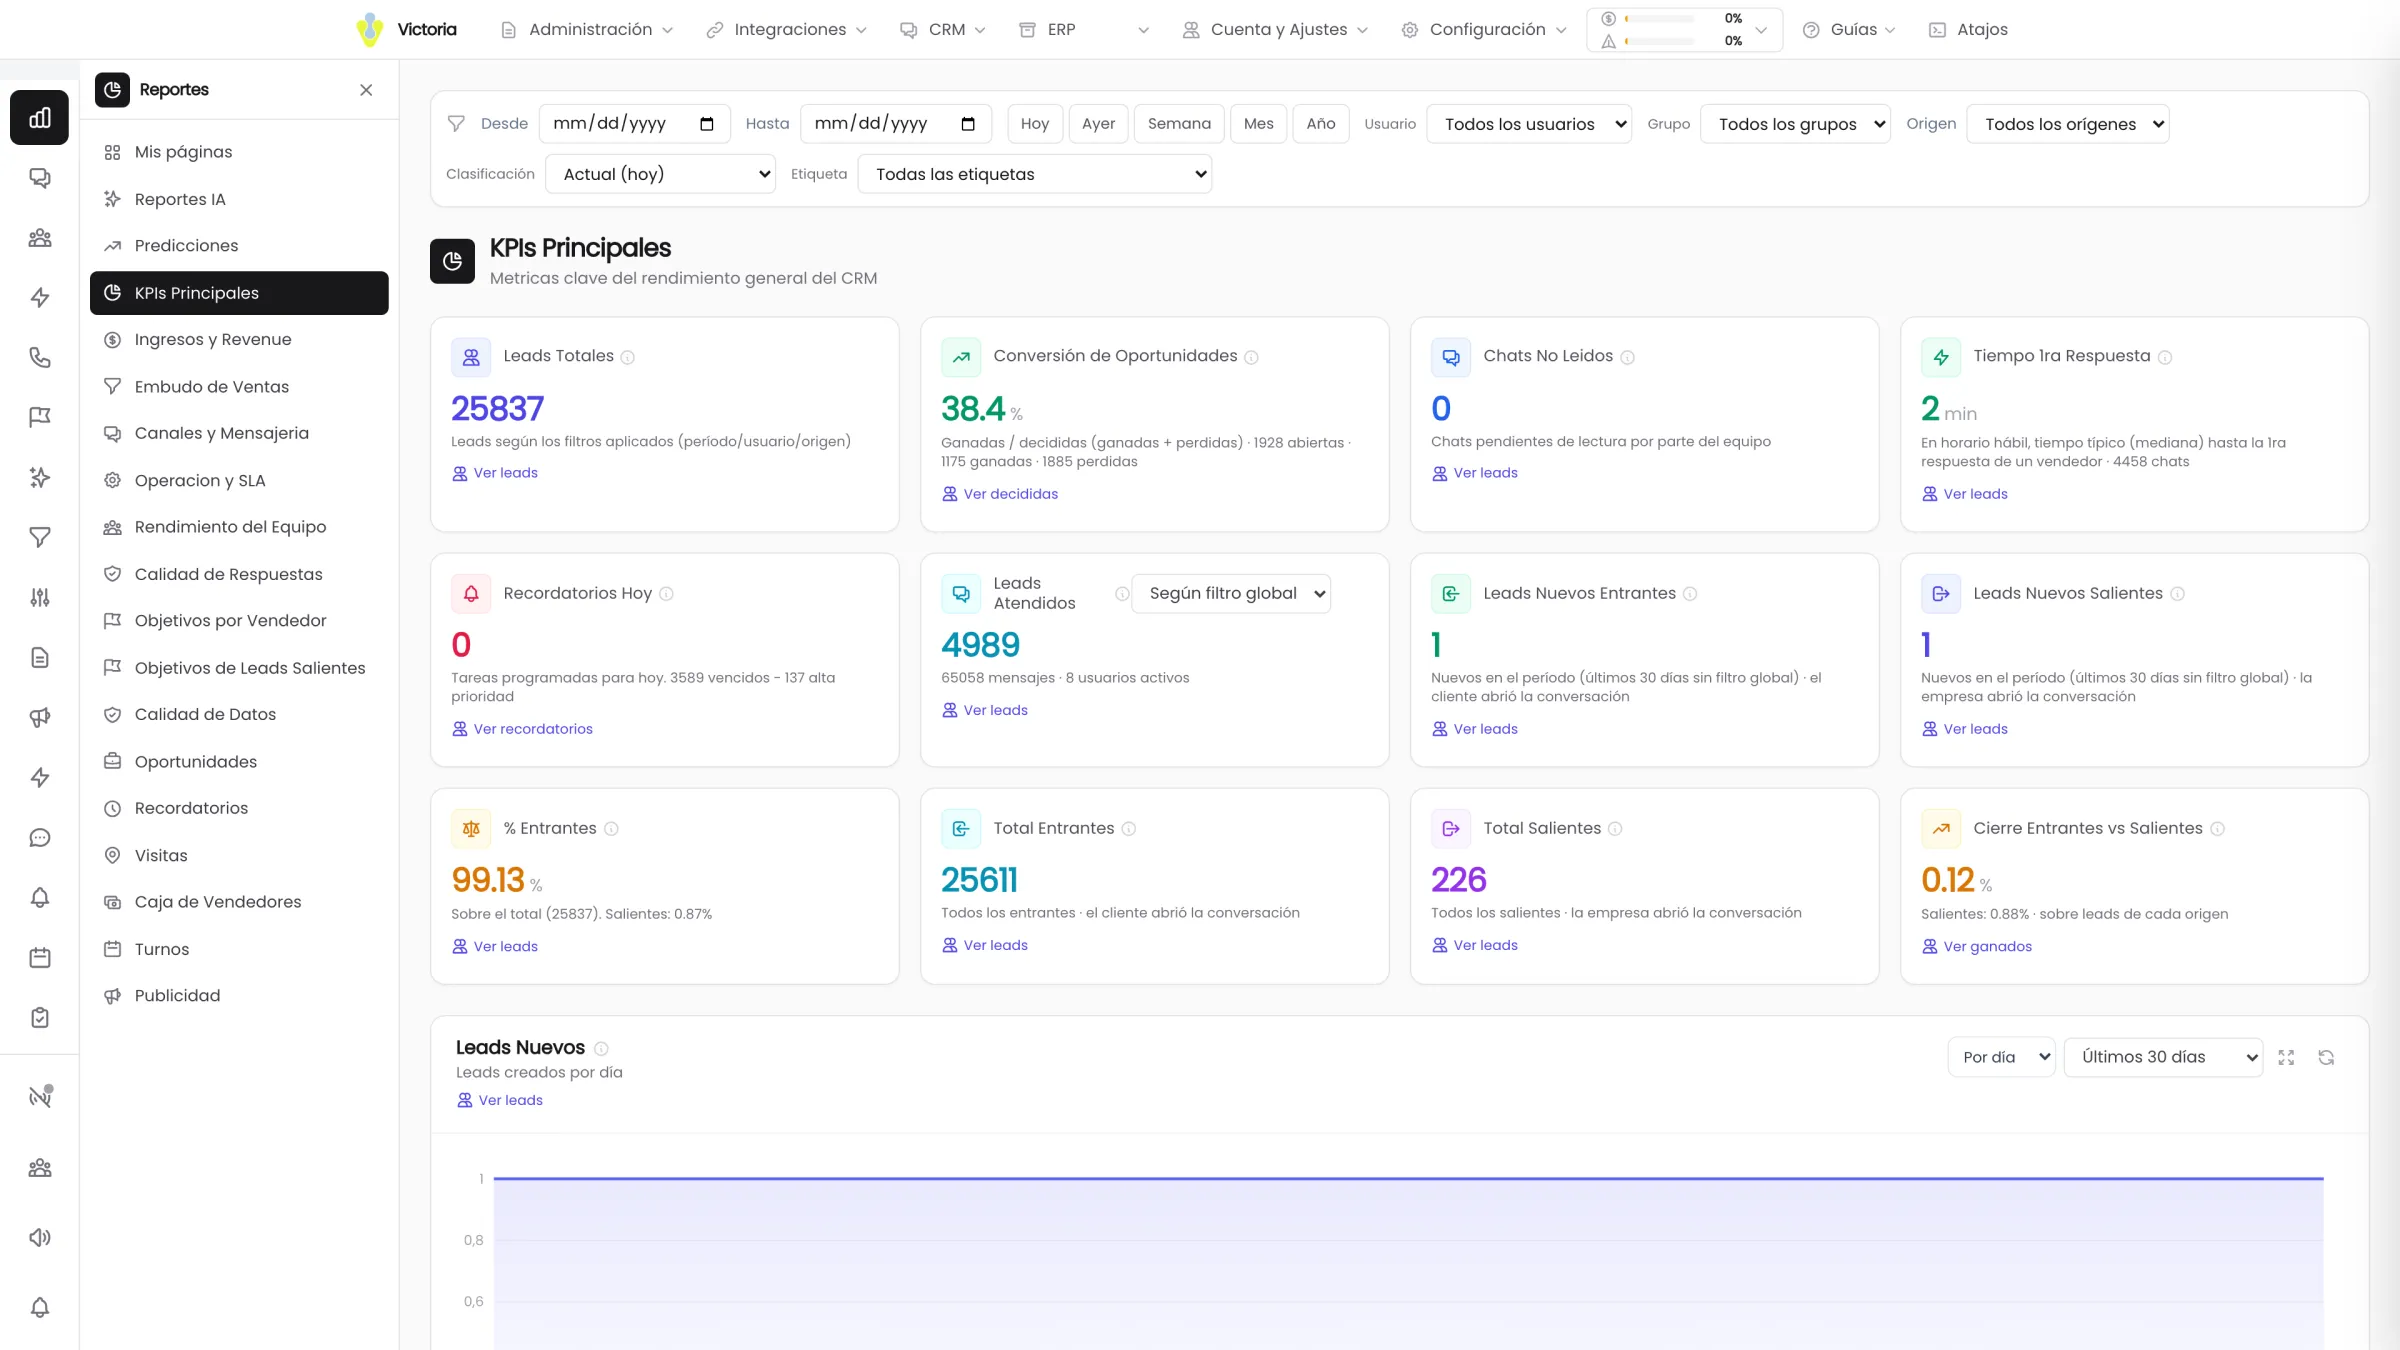
12 dashboard sections with global filters. Any number opens up and shows the leads and the opportunities behind it.
Data from the CRM and from the connected ERPs, always with the source stated.
The report arrives late and nobody can audit it.
Four questions that most sales teams answer with a spreadsheet built by hand.
Twelve sections, one single set of filters.
You pick date range, funnel, user, group, tag and source once. The whole dashboard recalculates.
Total leads, conversion, first response time and leads handled. Plus revenue, average deal size, time to close and the loss reasons on record.
- Main KPIs
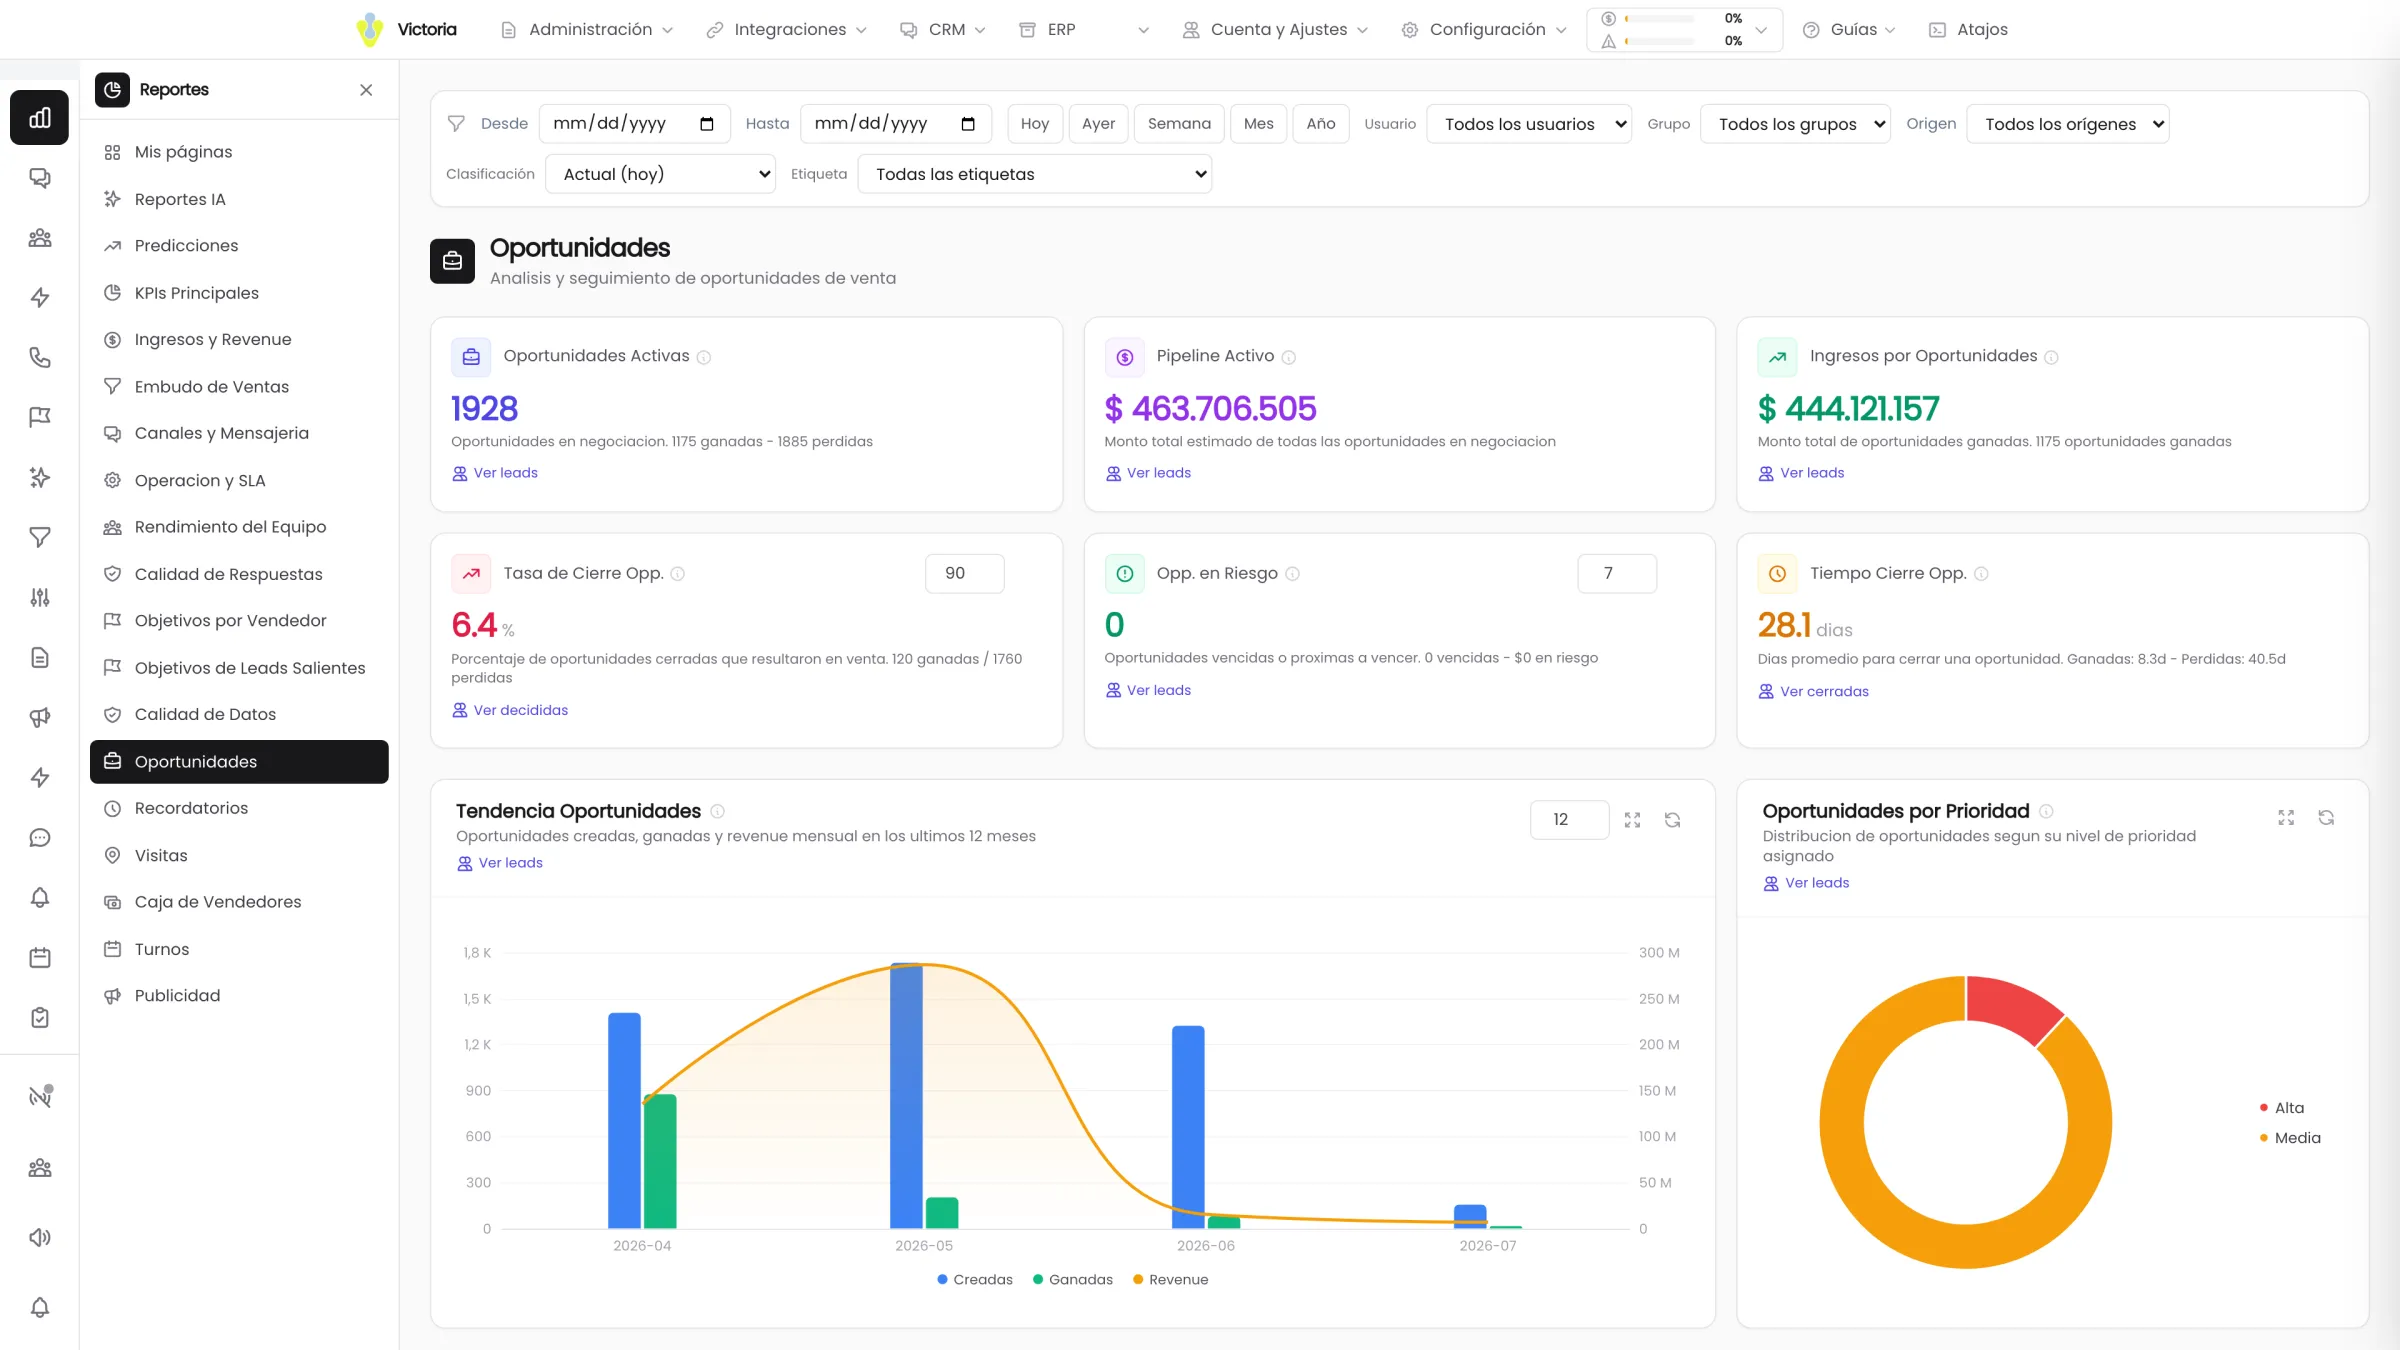
- Revenue and income
- 12dashboard sections
- 7global filters
- 3forecast scenarios
The revenue, goals, opportunities and advertising sections are shown only when the selected funnel is a sales one.
The twelfth section is the advertising one and has a block of its own further down. The two AI panels go separately.
Every number opens up and shows what it is made of.
No figure on the dashboard is a dead end. You click and the exact records behind it appear.
Click any bar, slice or point
The list of leads and opportunities behind the number opens, with 100 rows per page, sorting by column and a search box.
From the chart to the chat, without leaving the dashboard
Each row of the detail opens the customer conversation in a side panel. There is no need to go and find the lead on another screen.
Global filters, set once
Date range with presets, user, group, funnel, tag, inbound or outbound origin and classification mode: current, original or as of the period date.
The system says when a filter does not apply
When you filter by user or group, the dashboard states which indicators are affected and which are not, instead of showing numbers that look right and are not.
Two ways to measure "unanswered"
One by the direction of the last message and another by a manual flag from the team. They coexist on purpose and each one states which it is using.
Data quality as a section of its own
Chats with no lead attached, leads with no name, percentage of messages with attachments and potential duplicates. Data entry errors show up before they ruin a report.
Which ad brought the sale, not how many leads it brought.
Leads coming in from Meta ads arrive with their campaign inside them and carry it all the way to the closed sale.
- 01
It comes in from the ad
The customer taps "Send message" on a Facebook or Instagram ad and opens a conversation with your WhatsApp number.
- 02
It arrives with the context attached
Inside the first message the ad card appears: campaign, creative, headline and a link to the original ad.
- 03
The sale stays tied to it
When the opportunity is created and closed, the amount stays associated with that campaign and that specific ad.
- 04
Revenue is seen per ad
Leads per campaign, ads funnel, monthly trend and top ads with the creative thumbnail next to the amount.
A sale is defined by the opportunity won, not by the lead stage. That is the rule that keeps the same sale from being counted twice. Attribution covers Meta ads: Facebook and Instagram.
See IntegrationsYou ask in plain English. The report is built with your data.
Two panels over the same dashboard: one answers what you ask for, the other looks ahead.
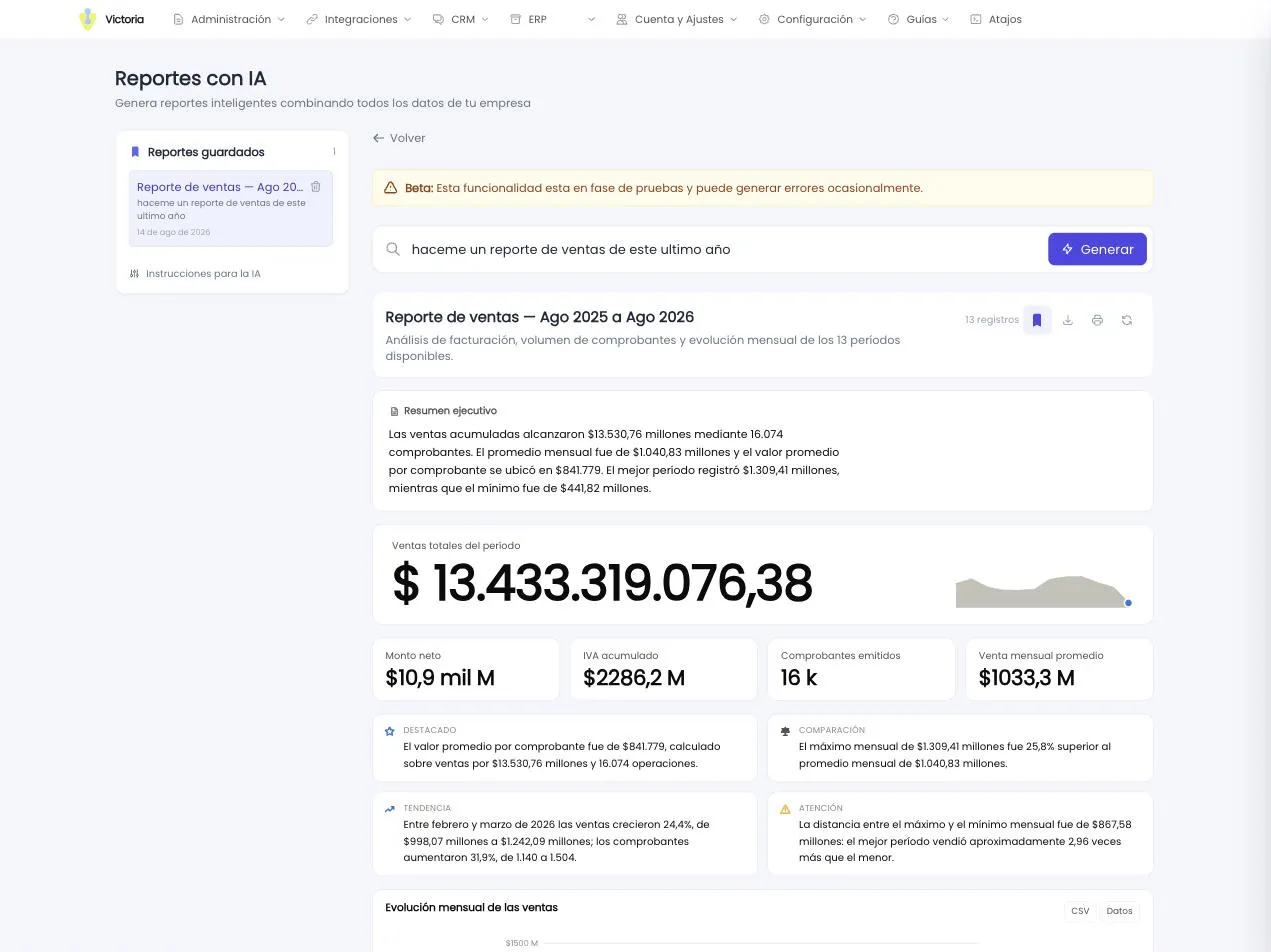
You write "last quarter sales per rep" and the system returns KPIs, a table, charts and observations. Then you ask for an adjustment — "add the VAT column and sort by margin" — and the report is rebuilt.
It is saved and re-run
Each report is saved with a name, re-run whenever you need it and downloaded as CSV or printed to PDF.
It always says where the data came from
Reports can read data from Victoria or from the connected ERP, and the source is stated in the result.
Analysis of won and lost
A suggested report reviews the last 90 days and explains why opportunities were won and why they were lost.
AI reports are in beta and can produce occasional errors. Every result can be checked against the dashboard detail before it is used.
Forecasts need at least 10 closed opportunities to be accurate. When there is not enough data, the panel says so.
Where these numbers come from.
We look at the dashboard with your numbers on it.
In the demo we connect a sample funnel and open any indicator all the way down to the lead. 30 minutes.
Victoria CRM · Software built by Victoria AI · Córdoba, Argentina.